Known Issues
Open points that affect users of FP2026.1. Limitations of a single meteorological variable are on that variable’s page under Meteorological data; release details are in Dataset versions. Planned work is tracked in the Issues of the repository.
No measured H from 10 January to 20 March 2019
There is no measured sensible heat flux between 10 January 2019 15:15 and 20 March 2019 18:45 (TIMESTAMP_MIDDLE), 3320 half-hours. The gap-filled series H_L3.1_L3.3_CUT_NONE_QCF_gfXG covers the period, so its values there come from the model alone; FLAG_H_L3.1_L3.3_CUT_NONE_QCF_gfXG_ISFILLED marks them.
The gap has two causes. Setup period 2019_2 (10 to 17 January 2019), in which both LI-7200 units were defective, has no Level-1 run, so its sonic data were not processed. In 2019_3 (17 January to 20 March 2019) the open-path LI-7500 stood in for the LI-7200; its run is processed with the other IRGA75 fluxes and is not part of FP2026.1. The same sonic was in operation throughout, so H could be computed for this period from these two setup periods. This is under review.
The gas fluxes FC, NEE and LE have the same gap, for the reasons above. See Level-4.1 for the other long gaps.
H in 2024 is lower than in the other years
The annual mean of the measured H is 25.8 W m-2 in 2024, against 33.9 to 51.8 W m-2 in the other full years 2016 to 2025, about a third lower. Incoming shortwave radiation was also lower in 2024 than in the other years, but the cause has not been checked yet. Treat annual H in 2024 with caution until it is.
MDS in spring 2016
In spring 2016 the measurements of the start-up period were removed (1 March to 25 May 2016), and the gap includes the leaf-out. MDS fills this gap from records far away in time and gives a much larger uptake than XGBoost: the April-May sum of NEE (CUT_50) is -235 gC m-2 with MDS and -113 gC m-2 with XGBoost. In the other years the April-May sums of both methods lie between -30 and -195 gC m-2. XGBoost is the gap-filling method of this dataset, and MDS is included for comparison only. Use the XGBoost series (_gfXG). See Level-4.1.
Fluxes of the open-path LI-7500 are not yet included
FP2026.1 contains fluxes of the enclosed-path LI-7200 (IRGA72) only, from 11 January 2016. The fluxes of the open-path LI-7500 (IRGA75, 2004 to 12 December 2017 and 17 January to 20 March 2019), with the self-heating correction of Level-1.1, are in progress for FP2026.2. FP2026.2 will contain FP2026.1 in full and supersede it.
USTAR thresholds lower than those of FLUXNET
FLUXNET detects USTAR thresholds per year with the method of Pastorello et al. (2020). For CH-LAE, the thresholds it detects change markedly after 2015 (Figure 1). The cause is not known. The change coincides with a change of gas analyser:
- until 11 January 2016, only the open-path LI-7500 was in operation;
- from 11 January 2016 to 12 December 2017, the LI-7500 and the enclosed-path LI-7200 ran in parallel;
- from 14 December 2017, only the LI-7200 was in operation, except from 17 January to 20 March 2019, when the LI-7500 stood in for it.
Before 2016, the threshold detection therefore used LI-7500 NEE, corrected for self-heating in a similar way to Kittler et al. (2017).
FP2026.1 does not use the FLUXNET thresholds. It filters NEE at three constant thresholds detected on the LI-7200 data of 2016 to 2024: 0.272 (CUT_16), 0.304 (CUT_50) and 0.340 m s-1 (CUT_84). These are kept on purpose although FLUXNET uses much higher thresholds for CH-LAE. See Level-3.3.
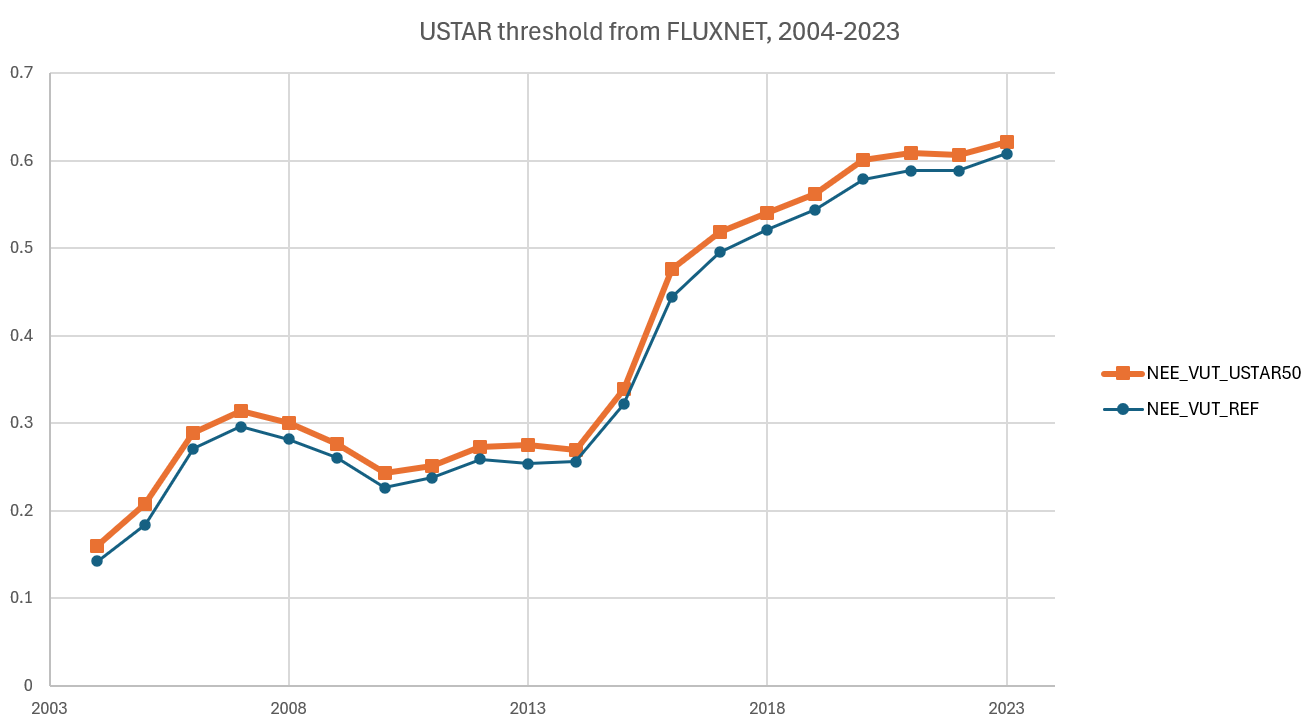
FLX_CH-Lae_FLUXNET2015_AUXNEE_2004-2023_1-3.csv.
Time shift in incoming shortwave radiation from 2022
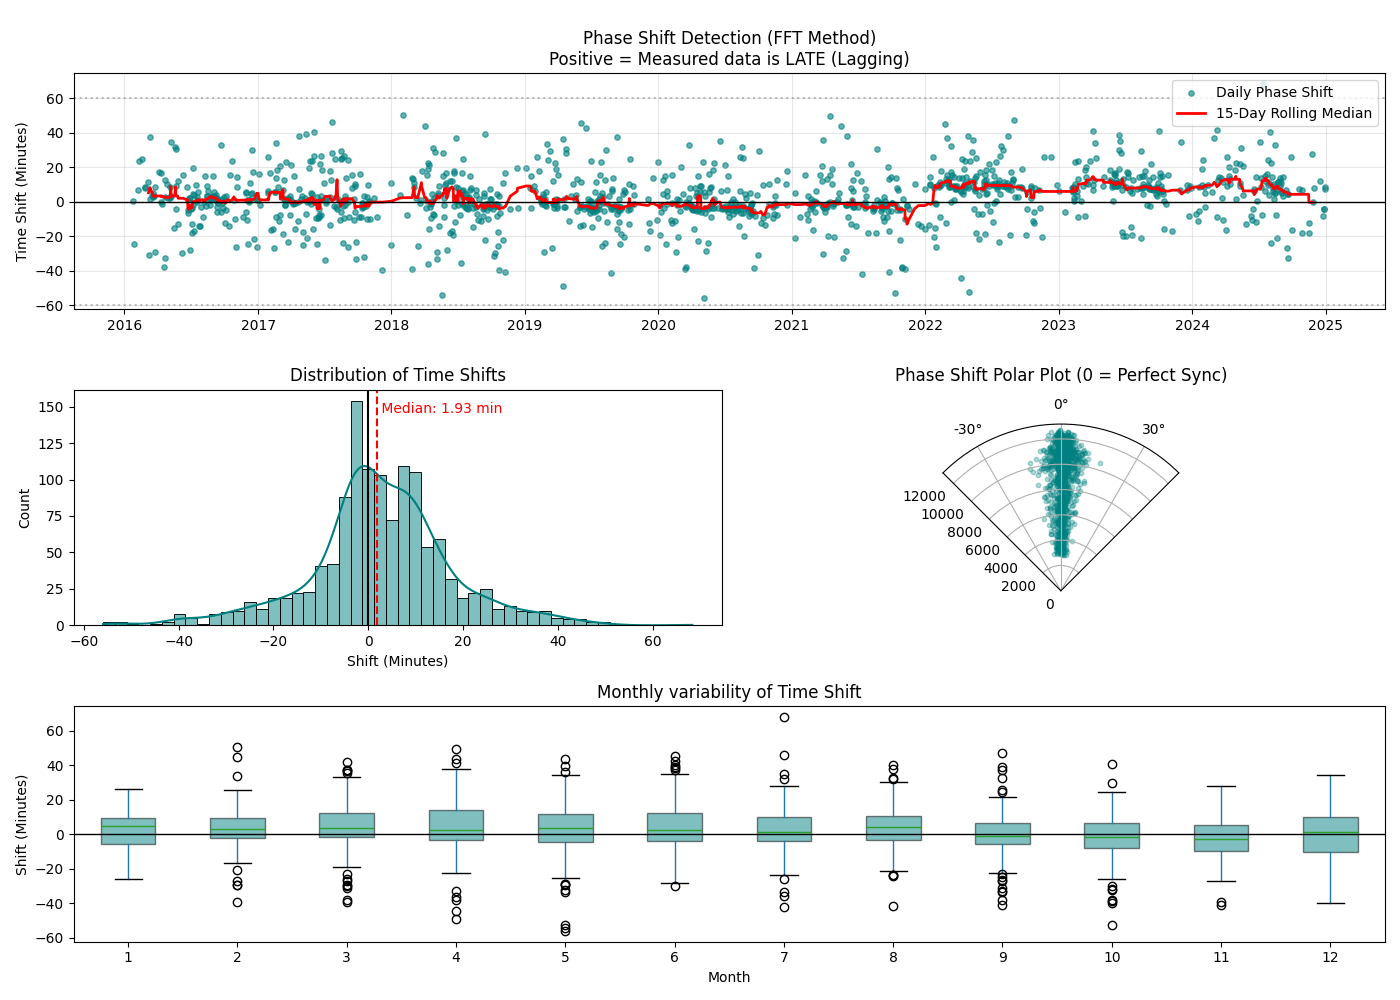
The daily cycle of incoming shortwave radiation at 47 m (SW_IN_T1_47_1) lags behind potential radiation by a few minutes from 2022 onwards (Figure 2). No error was found in the processing, and the shift is already present in the raw data. Its cause is not known. The product page is Incoming shortwave radiation at 47 m.
Method
The shift was detected by comparing the phase of the 24-hour component (FFT) of measured and potential radiation on clear days, selected as days on which the measured radiation reached at least 70 % of the potential. The 2016-2024 record has a median offset of +1.93 min; from 2022 the daily shifts are larger.
Checks of the processing
Each processing step was checked at the half-hour of 1 August 2022, 09:00 to 09:30, and by repeating the FFT analysis on data from different stages:
- Resampling. The 1-minute raw values from 09:01 to 09:30, averaged by hand, give 654.8015067 W m-2. The meteo screening, which reads the database and resamples to 30 minutes, gives 654.801507 W m-2. Resampling introduces no shift.
- Nighttime offset correction. With the correction of negative nighttime values (an offset of about -10 W m-2), the value is 665.219439 W m-2, the same in the screening output and in the screened data downloaded from the database. After all
SW_INsources are merged, the offset correction runs again on the merged record and gives 664.929319 W m-2. - Middle timestamp. When the record is loaded for gap-filling, its timestamp is converted to
TIMESTAMP_MIDDLE. The value at 09:15 is 664.929319 W m-2, unchanged. - Gap-filling and merging. The value is unchanged after gap-filling and after the merge with the flux data. Air temperature at 09:15, averaged by hand from the 1-minute raw files, matches as well.
- Database against raw files. The FFT analysis gives identical results on the 1-minute raw file of August 2022 and on the 1-minute data downloaded from the database, with a median shift of 6.39 min at 30-minute resolution and 5.90 min at 1-minute resolution. The same holds for July 2021, at both resolutions.