Site information
CH-LAE (Lägeren) is a managed mixed deciduous mountain forest on the south-facing slope of the Lägern, in the Jura mountain range that marks the northern boundary of the Swiss Plateau, north-west of Zurich (Etzold et al. 2011). The stand is diverse in species, diameter class and tree age, and has a complex canopy structure (Etzold et al. 2011; Shekhar et al. 2024). Eddy covariance measurements started in April 2004 and are ongoing.
This page draws on the Swiss FluxNet site page for CH-LAE and on two published site descriptions, Etzold et al. (2011) and Shekhar et al. (2024). Every value below names its source; where sources disagree, both are given. Details of the eddy covariance setup — sonic anemometer, gas analysers, sensor separations and the setup periods the flux runs are organised by — are listed per year in Yearly Notes; the dataset itself is described in Overview.
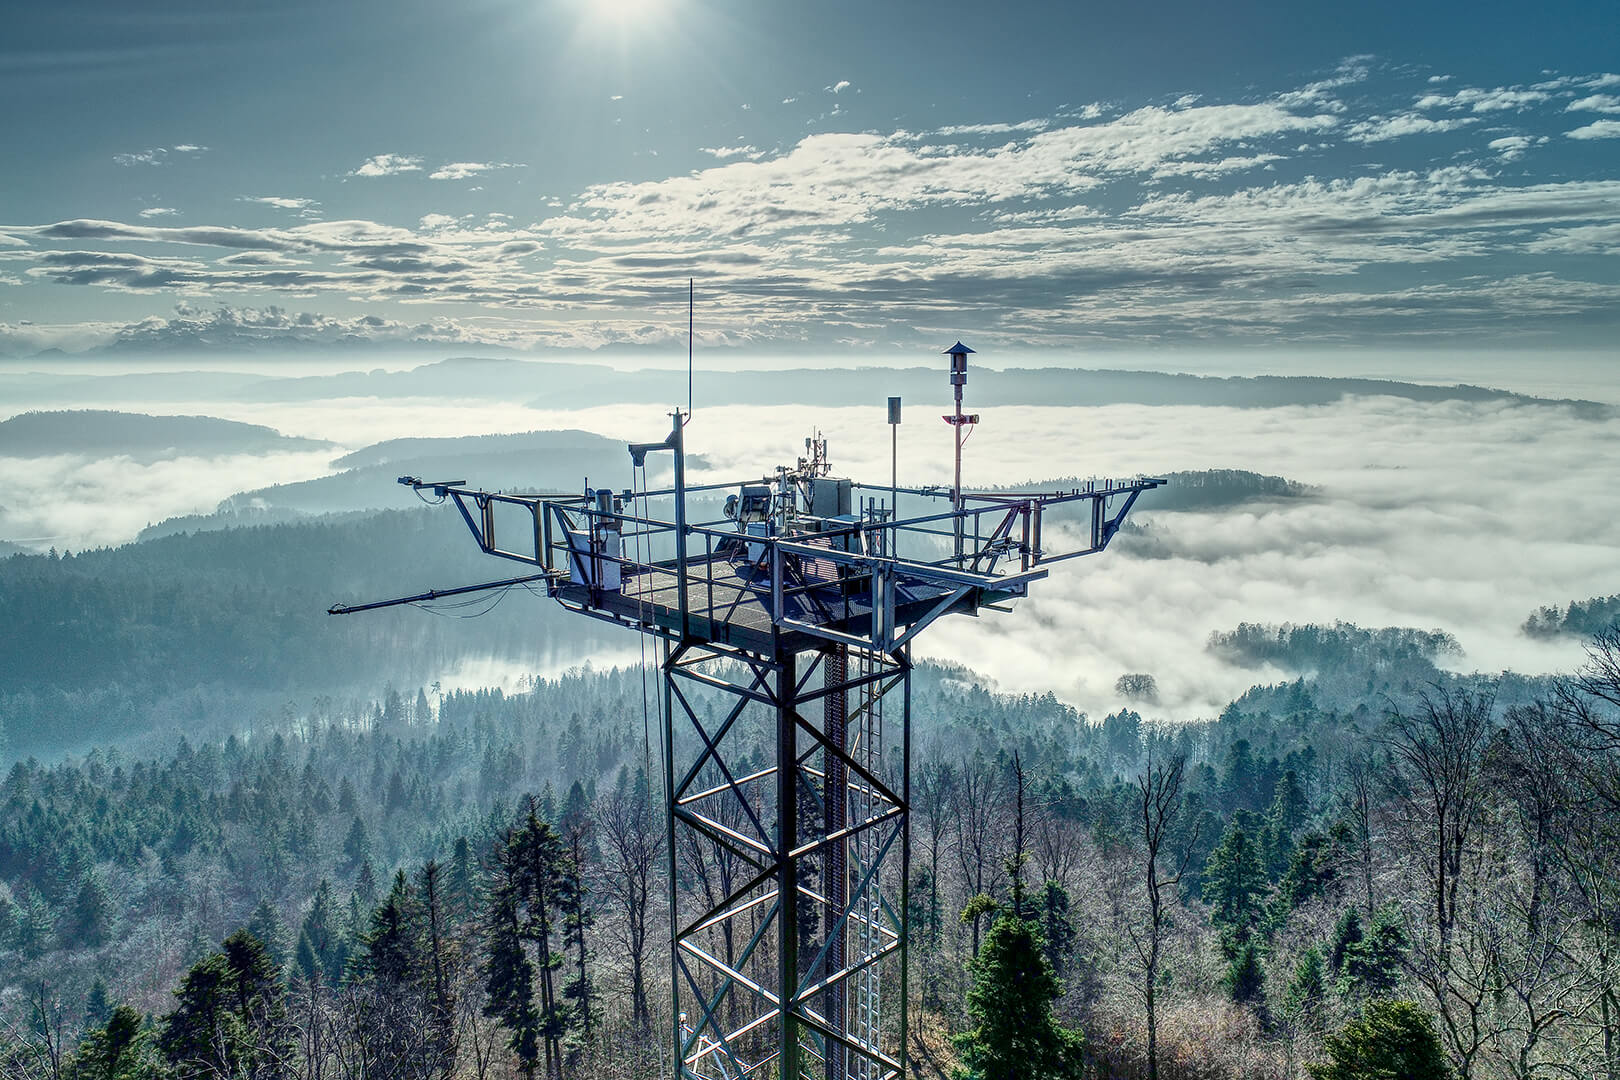
Location and terrain
| property | value |
|---|---|
| site code | CH-LAE |
| FLUXNET ID | CH-Lae |
| site name | Lägeren, Canton of Aargau, Switzerland |
| municipality | Wettingen, canton Aargau |
| locality | Zindlen |
| latitude | 47°28’42.0” N (47.478333) |
| longitude | 8°21’51.8” E (8.364389) |
| elevation | 689 m a.s.l. |
| IGBP class | Mixed forest (MF) |
| geographical region | Swiss Jura |
| altitudinal zone | montane |
| slope | 27°, south-facing |
Reported slopes differ, and the units are the trap: Etzold et al. (2011) give 27° for the flux site, while the LWF plot page gives a mean slope of 37 %, which is about 20°. The two describe different extents — the flux footprint against a 1.34 ha inventory plot — so they are not in conflict, but 37 % must not be read as 37°.
The slope is the property of this site that most affects the flux measurement. Advection on it contributes measurably to the carbon budget, and the site has been used as a study case for that term (Etzold et al. 2010). That work is also the origin of the constant friction-velocity threshold of 0.3 m s-1 that later studies of this site have applied (Shekhar et al. 2024); the threshold used in the present dataset is documented under QCF, not here.
The position in Table 1 is the correct one. Some published descriptions of the site give slightly different values: 682 m a.s.l. instead of 689 m (Etzold et al. 2011; Shekhar et al. 2024), and coordinates about 50 m away, 47°28’40.8” N, 8°21’55.2” E (Etzold et al. 2011). The prose of the Swiss FluxNet page separately describes the site as being at 800 m a.s.l., which characterises the mountain rather than the tower. Use the values in the table.
The tower position on a map: OpenStreetMap · Swiss national map (swisstopo) · Google Maps. The swisstopo map carries the relief and the forest cover, which show the slope and the extent of the stand better than a street map does.
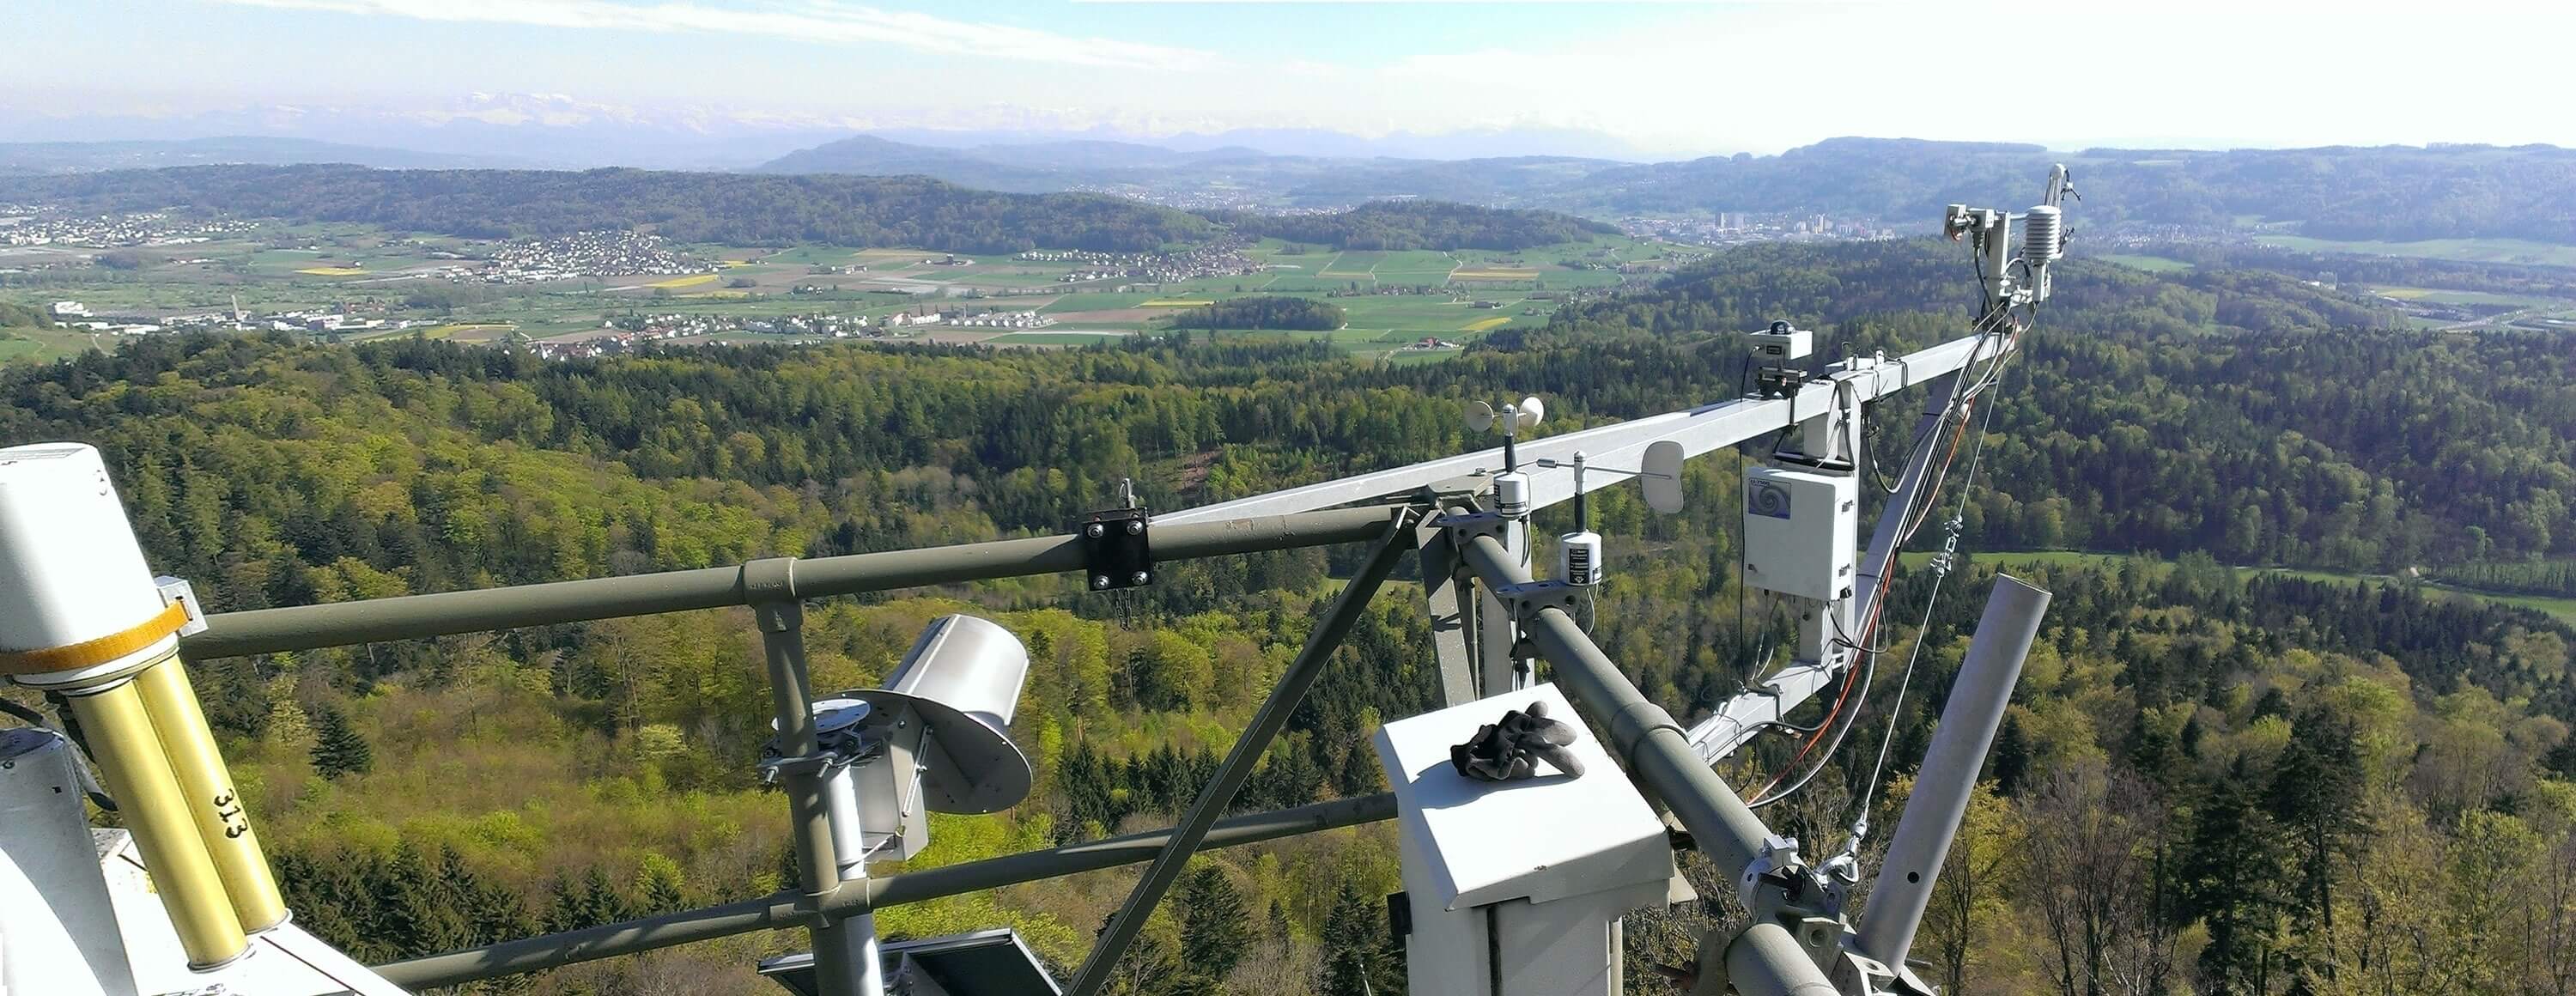
The tower
The tower is 47 m tall and belongs to WSL, which describes it on its Zindlen measurement tower page. It is not the original structure: the first tower was built under the Swiss National Research Programme NFP 14+, and was replaced after being damaged by storm Lothar in December 1999. The eddy covariance measurements of this dataset therefore begin, in 2004, on the replacement tower, and no part of the record spans the rebuild.
The tower carries instruments for several groups at once, which is why more than one measurement of the same quantity exists at this site — see Monitoring programmes and networks below. Physical access requires authorisation from the WSL safety officer.
The instruments of this dataset sit at the 47 m level; the NABEL sensors used as co-located references in the meteorological products are recorded at 49 m.
Climate
Published long-term means for the site differ, because they cover different periods and rest on different measurements. Both are given here rather than one.
The two temperature means are consistent with a warming record rather than in conflict: the Swiss FluxNet page reports 7.8 °C over 2005-2012 against 9.4 °C over 2013-2020, a difference of 1.6 °C between the two halves of that period. The two precipitation figures are not directly comparable — they cover different years and do not come from the same gauge — so neither should be used as the site value without saying which it is.
Every climate value on this page — the means above, the extremes below, and the growing-season conditions — comes from an external source or a published study, and each covers a period that ends before this dataset does. They are to be recomputed over 2004-2025 from the products documented here: air temperature from 02_METEO_TA, precipitation from 08_METEO_PREC, vapour pressure deficit from 07_METEO_VPD and soil water content from 09_METEO_SWC. Recomputed values will be cited as this dataset and will state their own period.
Once they exist, the tables are to hold only this dataset’s numbers; the published values are then dropped rather than kept alongside. The papers remain cited on this page, so a figure quoted from one of them can still be traced to its source.
| property | value |
|---|---|
| highest recorded temperature | 33.5 °C (25 July 2019) |
| lowest recorded temperature | -17.2 °C (7 February 2012) |
The site air temperature record is affected by a sensor and acquisition change in January 2016; see Air temperature for what that means for a comparison of early against late years. Measured precipitation at the tower is documented under Precipitation.
Three MeteoSwiss stations lie close enough to serve as references: Lägern (845 m a.s.l., 2.5 km), Ehrendingen (428 m a.s.l., 3.8 km) and Zürich/Kloten (426 m a.s.l.). Which of them covers which variable is not uniform — Lägern measures no precipitation and no longwave radiation, and Ehrendingen measures precipitation only. The reference used for each product is named on that product’s page under Meteorological data.
Growing season and dryness
Shekhar et al. (2024) characterise the site’s growing season and its water-related conditions over 2005-2022. These are useful for judging which years in the record are climatically unusual.
| property | value |
|---|---|
| mean soil moisture | 0.21 m3 m-3 |
| 10th percentile of soil moisture | 0.14 m3 m-3 |
| mean vapour pressure deficit | 1.1 kPa |
| 90th percentile of vapour pressure deficit | 2.1 kPa |
Days below the soil-moisture percentile occurred mainly in 2006, 2009, 2015 and 2018, and days that were both soil-dry and air-dry fell largely in 2015, 2018 and 2022; 2015 had the most extreme-dryness days of any year in that period (Shekhar et al. 2024). Soil moisture and vapour pressure deficit at the site are negatively correlated (r = -0.36), more strongly so than at the subalpine site the same study compares against.
Vegetation and stand structure
The stand is dominated by European beech (Fagus sylvatica L.), with ash (Fraxinus excelsior L.) and Norway spruce (Picea abies (L.) Karst.) the other abundant species (Etzold et al. 2011). Canopy composition has been quantified as beech 40 %, ash 19 %, sycamore maple (Acer pseudoplatanus L.) 13 %, European silver fir (Abies alba Mill.) 8 % and Norway spruce 4 % (Paul-Limoges et al. 2017; Shekhar et al. 2024). The Swiss FluxNet site page additionally lists Tilia cordata Mill., Quercus robur L. and Ulmus glabra Huds. as present. In spring, bear’s garlic (Allium ursinum L.) forms a dense understorey, growing from about March to June (Etzold et al. 2011; Shekhar et al. 2024).
| property | value | source |
|---|---|---|
| mean height of dominant trees | 30.6 m | Etzold et al. (2011); Swiss FluxNet |
| top-height diameter | 72.18 cm (quadratic mean of the 100 thickest trees per hectare) | Swiss FluxNet |
| stem density, DBH ≥ 12 cm | 503 trees (2011) | Swiss FluxNet |
| leaf area index | 4.1 ± 0.3 m2 m-2 (June 2006) | Swiss FluxNet |
| maximum leaf area index | 1.7-5.5 m2 m-2 | Etzold et al. (2011) |
| age of dominant Fagus sylvatica | 52-155 years | Etzold et al. (2011) |
| age of dominant Picea abies | 105-185 years | Etzold et al. (2011) |
| maximum age, Fagus sylvatica | approximately 150 years | Swiss FluxNet, LWF |
| maximum age, Picea abies | 120-170 years | Swiss FluxNet, LWF |
Four of the rows above — top-height diameter, stem density, and the two maximum ages — appear identically on the Swiss FluxNet site page and on the LWF plot page, and the LWF plot is where they were measured. That plot is 1.34 ha, installed on 1 May 2012 and spanning 643-718 m elevation. The flux footprint is very much larger and, as described under Management and footprint, spans two different management regimes. Stand statistics from the plot characterise the forest but should not be treated as an inventory of the area the fluxes come from.
The LWF plot classifies the woodland association, after Ellenberg and Klötzli (1972), as Galio odorati-Fagetum typicum to Pulmonario-Fagetum typicum.
The eddy covariance system and the meteorological sensors of this dataset are mounted at 47 m, well above the mean canopy height of about 30 m (Etzold et al. 2011; Shekhar et al. 2024).
Soil and geology
The bedrock is limestone, marl and sandstone, with transition zones between them (Swiss FluxNet site page). Soils are rendzic leptosols (rendzinas) and haplic cambisols in the World Reference Base classification (Etzold et al. 2011). The litter layer is thin: leaf litter decomposes nearly completely within one year (Swiss FluxNet site page).
| property | value |
|---|---|
| soil pH | 4.0-7.5 |
| soil carbon stock, 0-20 cm | 8.4-9.6 kg m-2 |
The LWF plot page classifies the same soils in the WSL scheme as calcareous brown soil, chromic luvisol and mixed rendzina, adding a luvisol that the World Reference Base pair above does not name.
The pH range is wide because the two soil types differ: rendzinas over limestone are near-neutral to alkaline, the cambisols acidic. Soil moisture and soil temperature measured at the forest floor are documented under Soil water content and Soil temperature.
Management and footprint
The forest is a high forest, and the two halves of the flux footprint are managed differently. The southern part has been managed under Forest Stewardship Council certification since 1998; the northern part is a nature reserve in which tree harvesting stopped around the late 1990s. Footprint modelling indicates that the eddy covariance fluxes draw on both parts in roughly equal proportion (Etzold et al. 2011).
This matters when the fluxes are interpreted: the measurement is not of a single management regime but an approximately even mixture of a managed and an unmanaged stand. Management events recorded for the site are listed under Management data.
Monitoring programmes and networks
The site belongs to several programmes beyond Swiss FluxNet, which is why more than one measurement record exists at the same location:
- Swiss FluxNet, operated by the Grassland Sciences Group, ETH Zurich, which runs the eddy covariance system this dataset is built from (Shekhar et al. 2024).
- NABEL, the Swiss national air pollution monitoring network, operated by EMPA, which runs its own meteorological sensors on the same tower (Etzold et al. 2011). The NABEL air temperature and radiation measurements at 49 m are used as co-located references in the meteorological products. WSL gives the NABEL presence as running through 2017; in the data used here the series ceases to be independent in mid-2018, and the meteorological products are built on the latter, which is measured rather than reported.
- LWF, the long-term forest ecosystem research programme of WSL (Swiss Federal Institute for Forest, Snow and Landscape Research), which runs the 1.34 ha inventory plot described above.
- The University of Zurich (Soil Science and Biogeochemistry) and a second ETH Zurich group (Land-Climate Dynamics) also measure at the plot (LWF).
- CarboEurope IP, the European carbon flux network the site joined at the start of the measurements (Swiss FluxNet site page).
The site is not an ICOS station. Shekhar et al. (2024) name ICOS Class 1 status for the subalpine site CH-Dav, which they treat alongside CH-LAE, not for CH-LAE itself.
Further information
- Swiss FluxNet site page for CH-LAE — the site description, and where the numbered notes referenced by the setup table in Yearly Notes are defined.
- EC raw binary format for CH-LAE — the setup periods, their raw file ranges and the notes that document corrections and unusable periods.
- CH-LAE FP2022 (2004-2022) — the previous release of this dataset, in the ETH Research Collection (Hörtnagl et al. 2023).
- WSL: Zindlen measurement tower — the tower itself, its history and the conditions of access.
- WSL LWF: Lägeren plot — the long-term forest ecosystem research plot, its inventory statistics and its deposition and foliar data.
- Instrumentation — the instruments deployed at the site and their measurement periods.