# --- Reference station ---
STAC_COLLECTION = 'ch.meteoschweiz.ogd-smn'  # full automatic weather stations
STAC_STATION = 'lae'                         # Lägern, 47.481933 N / 8.397222 E, 845 m

# --- Period ---
START = '2004-01-01'  # included (data actually begin 2004-02-01)
STOP = '2026-01-01'   # not included

# --- Time axis ---
TIMEZONE_OFFSET_TO_UTC_HOURS = 1  # UTC+01:00 (CET), same value the meteo notebooks use
TARGET_FREQ = '30min'
RECORDS_PER_BIN = 3  # three 10-min records make one complete 30MIN bin

# --- Parameters to export: shortname -> (output column, aggregation) ---
# 'mean' for state variables and 10-min means, 'sum' for durations, 'max' for gusts,
# 'circmean' for wind direction (see the helper: degrees cannot be averaged linearly).
PARAMS = {
    'tre200s0': ('TA_LAE_MS', 'mean'),          # air temperature 2 m [°C]
    'ure200s0': ('RH_LAE_MS', 'mean'),          # relative humidity 2 m [%]
    'tde200s0': ('TDEW_LAE_MS', 'mean'),        # dew point 2 m [°C]
    'pva200s0': ('VP_LAE_MS', 'mean'),          # vapour pressure 2 m [hPa]
    'prestas0': ('PA_LAE_MS', 'mean'),          # pressure at station altitude, QFE [hPa]
    'gre000z0': ('SW_IN_LAE_MS', 'mean'),       # global radiation [W m-2]
    'ods000z0': ('SW_IN_DIFF_LAE_MS', 'mean'),  # diffuse radiation [W m-2], from 2011
    'sre000z0': ('SUNDUR_LAE_MS', 'sum'),       # sunshine duration [min]
    'fve010z0': ('WS_LAE_MS', 'mean'),          # wind speed, vectorial 10-min mean [m s-1]
    'fkl010z1': ('WS_GUST_LAE_MS', 'max'),      # gust peak, 1 s maximum [m s-1]
    'dkl010z0': ('WD_LAE_MS', 'circmean'),      # wind direction, 10-min mean [°]
}

# --- Output ---
# Mirrors this notebook's own path under the external data folder, per the repo
# convention: a data file carries the same relative path as the code that produces it.
OUTDIR = (r'F:\Sync\luhk_work\dev-data\datasets-data\dataset_ch-lae_flux_product-data'
          r'\workflow\10_METEO\10_REFERENCE')
OUTNAME = 'MeteoSwiss_LAE_30MIN'
EXPORT_FORMATS = ('parquet', 'csv') # parquet keeps dtypes/index; csv is for eyeballing and sharingMeteoSwiss reference meteorology — Lägern (LAE), 2004-2025
Site: CH-LAE | Reference station: Lägern (LAE), MeteoSwiss Product: 30MIN 2004-2025 (aggregated from published 10-min values) Author: Lukas Hörtnagl (holukas@ethz.ch)
Source: MeteoSwiss. These data are free to use, but the source must be cited whenever they are reproduced or redistributed. Keep this attribution with any figure or derived product.
ℹ️ About this notebook
Downloads the full 10-minute record of the MeteoSwiss SMN station Lägern (lae) from the open-data STAC API, aggregates it to 30MIN, and writes one wide reference product.
This notebook does not touch the InfluxDB database and screens nothing. It only fetches an independent reference and puts it on our time axis.
Why LAE. It is the closest MeteoSwiss station to the tower — 2.5 km away on the same ridge, at 845 m, which is above the tower top (689 m base + 47 m). Unlike the NABEL sensors, which stop in 2018, it covers the whole record. It is a full automatic weather station, so one download yields references for TA, RH, PA and SW_IN at once.
What LAE does not measure. Checked against the data, not the station description:
| Variable | Parameter | Status |
|---|---|---|
| Precipitation | rre150z0 |
empty in every record — this is why the reference gauge is OED |
| Incoming longwave | oli000z0 |
empty in every record — notebook 06 (LW_IN) gets no reference here |
| Outgoing longwave / reflected shortwave | olo000z0, osr000z0 |
empty |
| Soil temperature | tso005s0, tso010s0, tso020s0 |
empty |
Coverage. The 10-min record begins 2004-02-01, so January 2004 has no LAE reference. From February 2004 on, every exported parameter is ≥99% complete in every year, except diffuse radiation (ods000z0), which only starts in 2011.
⏱️ Timestamp convention (important)
MeteoSwiss publishes all reference timestamps in UTC. For the 10-min files, reference_timestamp marks the end of the interval: a record at t covers (t-10min, t]. This matches our database’s TIMESTAMP_END, so the aggregated product is binned end-labelled and then shifted by TIMEZONE_OFFSET_TO_UTC_HOURS into local time.
This was verified empirically, not taken on trust — see Cross-check against the published hourly file below.
Instantaneous vs mean. The parameter descriptions distinguish two kinds of 10-min value, and the distinction survives into the 30MIN product:
gre000z0,ods000z0,dkl010z0are ten-minute means. Averaging three of them gives a true half-hourly mean.tre200s0,ure200s0,tde200s0,pva200s0,prestas0are current values — instantaneous spot readings. Averaging three gives a three-sample estimate of the half-hourly mean, not the mean itself. For smoothly varying quantities the difference is small, but it is not zero, and it is the honest description of what this product contains.
✏️ Settings
Imports
import io
import json
import urllib.request
from datetime import datetime
from pathlib import Path

import matplotlib.pyplot as plt
import numpy as np
import pandas as pd

pd.set_option('display.max_rows', 30)
pd.set_option('display.width', 1000)
print(f"Last run: {datetime.now().strftime('%Y-%m-%d %H:%M:%S')}")
print(f'pandas v{pd.__version__}')
Last run: 2026-07-20 20:59:47
pandas v3.0.3🔧 Helpers
STAC_ITEM_URL = f'https://data.geo.admin.ch/api/stac/v1/collections/{STAC_COLLECTION}/items/{STAC_STATION}'


def stac_assets(url: str) -> dict:
    """Return {filename: href} for a STAC item. Raises if the item has no assets."""
    with urllib.request.urlopen(url) as r:
        item = json.load(r)
    assets = {k: v['href'] for k, v in item.get('assets', {}).items()}
    if not assets:
        raise ValueError(f'STAC item {url} exposes no assets - wrong collection or station?')
    return assets


def read_ms_csv(href: str, params: list) -> pd.DataFrame:
    """Read one MeteoSwiss CSV and return *params* as a UTC-indexed, sorted DataFrame."""
    with urllib.request.urlopen(href) as r:
        df = pd.read_csv(io.BytesIO(r.read()), sep=';')
    missing = [p for p in params if p not in df.columns]
    if missing:
        raise ValueError(f'{missing} not in {href} (has: {list(df.columns)})')
    df['TIMESTAMP'] = pd.to_datetime(df['reference_timestamp'], format='%d.%m.%Y %H:%M')
    return df.set_index('TIMESTAMP')[params].sort_index()


def circular_mean(deg: pd.Series, freq: str) -> pd.Series:
    """Resample a direction in degrees by averaging on the unit circle.

    A linear mean is wrong for directions: 350° and 10° average to 180°
    (due south) instead of 0° (due north). Averaging the sine and cosine
    components and taking the arctangent gives the right answer.
    """
    rad = np.deg2rad(deg)
    res_s = np.sin(rad).resample(freq, label='right', closed='right').mean()
    res_c = np.cos(rad).resample(freq, label='right', closed='right').mean()
    return (np.rad2deg(np.arctan2(res_s, res_c)) % 360).where(res_s.notna())
Negative control
A helper that can silently do nothing gets a cell that feeds it bad input and asserts it raises.
# Wrong collection: LAE is a full weather station, not a precip-only station.
try:
    stac_assets(f'https://data.geo.admin.ch/api/stac/v1/collections/'
                f'ch.meteoschweiz.ogd-smn-precip/items/{STAC_STATION}')
except Exception as e:
    print(f'OK, raised as expected: {type(e).__name__}')
else:
    raise AssertionError('expected a failure for the precip-only collection, got assets')

# Wrong parameter name must raise rather than return an empty frame.
try:
    read_ms_csv(stac_assets(STAC_ITEM_URL)['ogd-smn_lae_t_historical_2010-2019.csv'], ['nosuchparam'])
except ValueError as e:
    print(f'OK, raised as expected: {str(e)[:60]}...')
else:
    raise AssertionError('expected a ValueError for an unknown parameter')

# circular_mean must not return the linear mean across the 0/360 wrap.
_idx = pd.date_range('2020-01-01 00:00', periods=6, freq='10min')
_test = pd.Series([350.0, 10.0, 350.0, 10.0, 350.0, 10.0], index=_idx)
_got = circular_mean(_test, '30min').iloc[0]
assert _got > 340 or _got < 20, f'circular mean across the wrap is broken: got {_got}'
print(f'OK, circular mean of [350, 10, 350] = {_got:.1f}° (a linear mean would give 236.7°)')
OK, raised as expected: HTTPError
OK, raised as expected: ['nosuchparam'] not in https://data.geo.admin.ch/ch.meteosch...
OK, circular mean of [350, 10, 350] = 350.0° (a linear mean would give 236.7°)⬇️ Available files
assets = stac_assets(STAC_ITEM_URL)
print(f'Station: {STAC_STATION.upper()}  |  collection: {STAC_COLLECTION}')
for k in sorted(assets):
    print(f'  {k}')
Station: LAE | collection: ch.meteoschweiz.ogd-smn
ogd-smn_lae_d_historical.csv
ogd-smn_lae_d_recent.csv
ogd-smn_lae_h_historical_1980-1989.csv
ogd-smn_lae_h_historical_1990-1999.csv
ogd-smn_lae_h_historical_2000-2009.csv
ogd-smn_lae_h_historical_2010-2019.csv
ogd-smn_lae_h_historical_2020-2029.csv
ogd-smn_lae_h_now.csv
ogd-smn_lae_h_recent.csv
ogd-smn_lae_m.csv
ogd-smn_lae_t_historical_2000-2009.csv
ogd-smn_lae_t_historical_2010-2019.csv
ogd-smn_lae_t_historical_2020-2029.csv
ogd-smn_lae_t_now.csv
ogd-smn_lae_t_recent.csv
ogd-smn_lae_y.csv📥 Download the 10-min record
The three _t_historical_ files already cover 2004-2025; _t_recent holds the current year and is deliberately not used, so re-running this notebook reproduces the same product.
hires_files = sorted(k for k in assets if '_t_historical_' in k)
print(f'Concatenating: {hires_files}')

raw = pd.concat([read_ms_csv(assets[k], list(PARAMS)) for k in hires_files]).sort_index()
raw = raw[~raw.index.duplicated(keep='first')]
raw = raw.loc[START:STOP]
print(f'10MIN raw: {len(raw):,} records, {raw.index[0]} -> {raw.index[-1]} (UTC)')

raw = raw.reindex(pd.date_range(raw.index[0], raw.index[-1], freq='10min'))
print(f'On gapless grid: {len(raw):,} records')
print(f'\nMissing per parameter:')
for short, (name, _) in PARAMS.items():
    print(f'  {short}  {name:<20s} {raw[short].isna().mean() * 100:6.2f}%')
Concatenating: ['ogd-smn_lae_t_historical_2000-2009.csv', 'ogd-smn_lae_t_historical_2010-2019.csv', 'ogd-smn_lae_t_historical_2020-2029.csv']
10MIN raw: 1,152,553 records, 2004-02-01 00:00:00 -> 2025-12-31 23:50:00 (UTC)
On gapless grid: 1,152,720 records
Missing per parameter:
tre200s0 TA_LAE_MS 0.07%
ure200s0 RH_LAE_MS 0.08%
tde200s0 TDEW_LAE_MS 0.08%
pva200s0 VP_LAE_MS 0.08%
prestas0 PA_LAE_MS 0.11%
gre000z0 SW_IN_LAE_MS 0.03%
ods000z0 SW_IN_DIFF_LAE_MS 30.58%
sre000z0 SUNDUR_LAE_MS 0.04%
fve010z0 WS_LAE_MS 0.63%
fkl010z1 WS_GUST_LAE_MS 0.63%
dkl010z0 WD_LAE_MS 0.10%Coverage per year
Proves the claim in About this notebook rather than asserting it.
_cov = raw.notna().groupby(raw.index.year).mean().mul(100).round(1)
_cov.columns = [PARAMS[c][0] for c in _cov.columns]
_cov| TA_LAE_MS | RH_LAE_MS | TDEW_LAE_MS | VP_LAE_MS | PA_LAE_MS | SW_IN_LAE_MS | SW_IN_DIFF_LAE_MS | SUNDUR_LAE_MS | WS_LAE_MS | WS_GUST_LAE_MS | WD_LAE_MS | |
|---|---|---|---|---|---|---|---|---|---|---|---|
| 2004 | 100.0 | 100.0 | 100.0 | 100.0 | 100.0 | 100.0 | 0.0 | 100.0 | 100.0 | 100.0 | 100.0 |
| 2005 | 100.0 | 100.0 | 100.0 | 100.0 | 100.0 | 100.0 | 0.0 | 100.0 | 100.0 | 100.0 | 100.0 |
| 2006 | 100.0 | 100.0 | 100.0 | 100.0 | 100.0 | 100.0 | 0.0 | 100.0 | 100.0 | 100.0 | 100.0 |
| 2007 | 100.0 | 100.0 | 100.0 | 100.0 | 100.0 | 100.0 | 0.0 | 100.0 | 100.0 | 100.0 | 100.0 |
| 2008 | 100.0 | 100.0 | 100.0 | 100.0 | 100.0 | 100.0 | 0.0 | 100.0 | 100.0 | 100.0 | 100.0 |
| 2009 | 100.0 | 100.0 | 100.0 | 100.0 | 100.0 | 100.0 | 0.0 | 100.0 | 100.0 | 100.0 | 100.0 |
| 2010 | 100.0 | 100.0 | 100.0 | 100.0 | 100.0 | 100.0 | 23.6 | 100.0 | 100.0 | 100.0 | 100.0 |
| 2011 | 100.0 | 99.8 | 99.8 | 99.8 | 100.0 | 100.0 | 99.9 | 100.0 | 100.0 | 100.0 | 100.0 |
| 2012 | 99.6 | 99.6 | 99.6 | 99.6 | 99.6 | 99.5 | 99.3 | 99.3 | 99.7 | 99.7 | 99.7 |
| 2013 | 100.0 | 100.0 | 100.0 | 100.0 | 99.6 | 100.0 | 99.8 | 100.0 | 100.0 | 100.0 | 100.0 |
| 2014 | 99.8 | 99.8 | 99.8 | 99.8 | 99.8 | 99.9 | 99.8 | 99.9 | 99.8 | 99.8 | 99.8 |
| 2015 | 100.0 | 100.0 | 100.0 | 100.0 | 99.1 | 100.0 | 100.0 | 100.0 | 100.0 | 100.0 | 100.0 |
| 2016 | 100.0 | 100.0 | 100.0 | 100.0 | 99.6 | 100.0 | 100.0 | 100.0 | 100.0 | 100.0 | 100.0 |
| 2017 | 100.0 | 100.0 | 100.0 | 100.0 | 100.0 | 100.0 | 99.9 | 100.0 | 88.5 | 88.5 | 100.0 |
| 2018 | 100.0 | 100.0 | 100.0 | 100.0 | 100.0 | 100.0 | 100.0 | 100.0 | 98.7 | 98.7 | 98.7 |
| 2019 | 100.0 | 100.0 | 100.0 | 100.0 | 100.0 | 100.0 | 100.0 | 100.0 | 100.0 | 100.0 | 100.0 |
| 2020 | 99.8 | 99.8 | 99.8 | 99.8 | 99.8 | 100.0 | 99.7 | 100.0 | 99.8 | 99.8 | 99.8 |
| 2021 | 99.2 | 99.2 | 99.2 | 99.2 | 100.0 | 100.0 | 100.0 | 100.0 | 100.0 | 100.0 | 100.0 |
| 2022 | 100.0 | 100.0 | 100.0 | 100.0 | 100.0 | 100.0 | 99.9 | 100.0 | 100.0 | 100.0 | 100.0 |
| 2023 | 100.0 | 100.0 | 100.0 | 100.0 | 100.0 | 100.0 | 100.0 | 100.0 | 100.0 | 100.0 | 100.0 |
| 2024 | 100.0 | 100.0 | 100.0 | 100.0 | 100.0 | 100.0 | 99.8 | 100.0 | 99.8 | 99.8 | 99.8 |
| 2025 | 100.0 | 100.0 | 100.0 | 100.0 | 100.0 | 100.0 | 99.9 | 100.0 | 99.9 | 99.9 | 99.9 |
⏲️ Aggregate to 30MIN
One rule per parameter, from the PARAMS table. N_RECORDS counts the 10-min values behind each bin so an incomplete bin can be told from a complete one downstream.
def aggregate(df: pd.DataFrame, freq: str) -> pd.DataFrame:
    """Aggregate 10-min (end-labelled) values to *freq*, one rule per parameter."""
    res = df.resample(freq, label='right', closed='right')
    out = {}
    for short, (name, how) in PARAMS.items():
        if how == 'mean':
            out[name] = res[short].mean()
        elif how == 'sum':
            out[name] = res[short].sum(min_count=1)  # min_count: all-NaN stays NaN, not 0
        elif how == 'max':
            out[name] = res[short].max()
        elif how == 'circmean':
            out[name] = circular_mean(df[short], freq)
        else:
            raise ValueError(f'unknown aggregation {how!r} for {short}')
    out['N_RECORDS'] = res['tre200s0'].count()
    return pd.DataFrame(out)


lae30 = aggregate(raw, TARGET_FREQ)
print(f'{TARGET_FREQ}: {len(lae30):,} periods, {lae30.index[0]} -> {lae30.index[-1]} (UTC)')
_inc = lae30['N_RECORDS'] < RECORDS_PER_BIN
print(f'Incomplete bins (N_RECORDS < {RECORDS_PER_BIN}): {_inc.sum():,} ({_inc.mean() * 100:.3f}%)')
lae30.head()
30min: 384,241 periods, 2004-02-01 00:00:00 -> 2026-01-01 00:00:00 (UTC)
Incomplete bins (N_RECORDS < 3): 280 (0.073%)| TA_LAE_MS | RH_LAE_MS | TDEW_LAE_MS | VP_LAE_MS | PA_LAE_MS | SW_IN_LAE_MS | SW_IN_DIFF_LAE_MS | SUNDUR_LAE_MS | WS_LAE_MS | WS_GUST_LAE_MS | WD_LAE_MS | N_RECORDS | |
|---|---|---|---|---|---|---|---|---|---|---|---|---|
| 2004-02-01 00:00:00 | 4.400000 | 81.200000 | 1.500000 | 6.800000 | 921.100000 | 0.0 | NaN | 0.0 | 10.400000 | 21.0 | 219.000000 | 1 |
| 2004-02-01 00:30:00 | 4.466667 | 80.700000 | 1.433333 | 6.800000 | 921.166667 | 2.0 | NaN | 0.0 | 11.500000 | 25.0 | 216.999898 | 3 |
| 2004-02-01 01:00:00 | 4.533333 | 80.633333 | 1.466667 | 6.800000 | 921.066667 | 2.0 | NaN | 0.0 | 12.233333 | 26.5 | 216.333296 | 3 |
| 2004-02-01 01:30:00 | 4.700000 | 80.333333 | 1.600000 | 6.900000 | 921.500000 | 2.0 | NaN | 0.0 | 11.100000 | 23.1 | 217.000000 | 3 |
| 2004-02-01 02:00:00 | 4.600000 | 80.733333 | 1.566667 | 6.833333 | 921.633333 | 2.0 | NaN | 0.0 | 11.966667 | 24.8 | 217.000000 | 3 |
Guard: prove the binning
Picks one half-hour and shows the three 10-min records behind it, so the (t-30min, t] convention is demonstrated on real numbers instead of asserted.
_probe = pd.Timestamp('2015-06-15 10:00')
_window = raw.loc[_probe - pd.Timedelta(minutes=20):_probe, ['tre200s0', 'gre000z0']]
print(f'10-min records feeding the bin labelled {_probe}:')
print(_window.to_string())
print(f'\nmean TA  = {_window["tre200s0"].mean():.4f}  '
      f'-> exported {lae30.loc[_probe, "TA_LAE_MS"]:.4f}')
print(f'mean SW  = {_window["gre000z0"].mean():.4f}  '
      f'-> exported {lae30.loc[_probe, "SW_IN_LAE_MS"]:.4f}')

assert np.isclose(_window['tre200s0'].mean(), lae30.loc[_probe, 'TA_LAE_MS'])
assert np.isclose(_window['gre000z0'].mean(), lae30.loc[_probe, 'SW_IN_LAE_MS'])
assert lae30.loc[_probe, 'N_RECORDS'] == RECORDS_PER_BIN
print('\nOK: the bin labelled t is the mean over (t-30min, t]')
10-min records feeding the bin labelled 2015-06-15 10:00:00:
tre200s0 gre000z0
2015-06-15 09:40:00 12.2 224.0
2015-06-15 09:50:00 12.2 250.0
2015-06-15 10:00:00 12.5 237.0
mean TA = 12.3000 -> exported 12.3000
mean SW = 237.0000 -> exported 237.0000
OK: the bin labelled t is the mean over (t-30min, t]Sanity checks
# Axis is continuous, unique and at the expected resolution.
assert lae30.index.is_monotonic_increasing, 'index not sorted'
assert not lae30.index.has_duplicates, 'duplicate timestamps'
_diffs = lae30.index.to_series().diff().dropna().unique()
assert len(_diffs) == 1 and _diffs[0] == pd.Timedelta(TARGET_FREQ), f'irregular index: {_diffs}'

# Physical ranges. Deliberately generous: this is a guard against unit or sign errors,
# not a quality screening -- screening reference data is not this notebook's job.
RANGES = {'TA_LAE_MS': (-30, 45), 'RH_LAE_MS': (0, 100), 'TDEW_LAE_MS': (-40, 30),
          'VP_LAE_MS': (0, 50), 'PA_LAE_MS': (850, 950), 'SW_IN_LAE_MS': (-20, 1400),
          'SW_IN_DIFF_LAE_MS': (-20, 1000), 'SUNDUR_LAE_MS': (0, 30),
          'WS_LAE_MS': (0, 60), 'WS_GUST_LAE_MS': (0, 80), 'WD_LAE_MS': (0, 360)}
for col, (lo, hi) in RANGES.items():
    s = lae30[col].dropna()
    assert s.between(lo, hi).all(), (
        f'{col} outside [{lo}, {hi}]: min {s.min()}, max {s.max()}')
    print(f'  {col:<20s} {s.min():>9.2f} .. {s.max():>9.2f}   OK')
print('\nAll sanity checks passed.')
TA_LAE_MS -17.70 .. 32.90 OK
RH_LAE_MS 3.67 .. 100.00 OK
TDEW_LAE_MS -27.03 .. 21.43 OK
VP_LAE_MS 0.67 .. 25.57 OK
PA_LAE_MS 881.70 .. 942.53 OK
SW_IN_LAE_MS 0.00 .. 1155.33 OK
SW_IN_DIFF_LAE_MS 0.00 .. 640.33 OK
SUNDUR_LAE_MS 0.00 .. 30.00 OK
WS_LAE_MS 0.00 .. 17.40 OK
WS_GUST_LAE_MS 0.00 .. 37.60 OK
WD_LAE_MS 0.00 .. 360.00 OK
All sanity checks passed.✅ Cross-check against the published hourly file
MeteoSwiss also publishes an hourly product for this station. Rolling our 30MIN product up to hourly and comparing is the independent check that the timestamp convention is right.
Read the result carefully: the two products agree in the mean but not record by record, and that is expected. The published hourly file is not a rollup of the published 10-min file — MeteoSwiss computes it from the underlying high-frequency samples, which are not published. So this is a bias check, not an equality check: a mean difference near zero confirms the alignment; the spread reflects two different aggregations of the same instrument.
HOURLY = {'tre200h0': 'TA_LAE_MS', 'ure200h0': 'RH_LAE_MS',
          'gre000h0': 'SW_IN_LAE_MS', 'prestah0': 'PA_LAE_MS'}
_hfiles = sorted(k for k in assets if '_h_historical_' in k
                 and any(d in k for d in ('2000-2009', '2010-2019', '2020-2029')))
pub_h = pd.concat([read_ms_csv(assets[k], list(HOURLY)) for k in _hfiles]).sort_index()
pub_h = pub_h[~pub_h.index.duplicated(keep='first')].loc[START:STOP]

mine_h = lae30[list(HOURLY.values())].resample('h', label='right', closed='right').mean()

print(f'{"parameter":<14s} {"n":>8s} {"mean diff":>12s} {"median |d|":>12s} {"corr":>10s}')
for short, name in HOURLY.items():
    j = pd.concat([mine_h[name].rename('mine'), pub_h[short].rename('pub')], axis=1).dropna()
    d = j['mine'] - j['pub']
    print(f'{name:<14s} {len(j):>8,} {d.mean():>+12.4f} {d.abs().median():>12.4f} '
          f'{j["mine"].corr(j["pub"]):>10.6f}')
parameter n mean diff median |d| corr
TA_LAE_MS 191,982 -0.0055 0.0833 0.998932
RH_LAE_MS 191,963 -0.0066 0.2000 0.991085
SW_IN_LAE_MS 192,058 -0.0725 0.3333 0.977479
PA_LAE_MS 191,900 -0.0049 0.0500 0.999634C:\Users\nopan\AppData\Local\Temp\ipykernel_6612\1453691142.py:12: Pandas4Warning: Sorting by default when concatenating all DatetimeIndex is deprecated. In the future, pandas will respect the default of `sort=False`. Specify `sort=True` or `sort=False` to silence this message. If you see this warnings when not directly calling concat, report a bug to pandas.
j = pd.concat([mine_h[name].rename('mine'), pub_h[short].rename('pub')], axis=1).dropna()
C:\Users\nopan\AppData\Local\Temp\ipykernel_6612\1453691142.py:12: Pandas4Warning: Sorting by default when concatenating all DatetimeIndex is deprecated. In the future, pandas will respect the default of `sort=False`. Specify `sort=True` or `sort=False` to silence this message. If you see this warnings when not directly calling concat, report a bug to pandas.
j = pd.concat([mine_h[name].rename('mine'), pub_h[short].rename('pub')], axis=1).dropna()
C:\Users\nopan\AppData\Local\Temp\ipykernel_6612\1453691142.py:12: Pandas4Warning: Sorting by default when concatenating all DatetimeIndex is deprecated. In the future, pandas will respect the default of `sort=False`. Specify `sort=True` or `sort=False` to silence this message. If you see this warnings when not directly calling concat, report a bug to pandas.
j = pd.concat([mine_h[name].rename('mine'), pub_h[short].rename('pub')], axis=1).dropna()
C:\Users\nopan\AppData\Local\Temp\ipykernel_6612\1453691142.py:12: Pandas4Warning: Sorting by default when concatenating all DatetimeIndex is deprecated. In the future, pandas will respect the default of `sort=False`. Specify `sort=True` or `sort=False` to silence this message. If you see this warnings when not directly calling concat, report a bug to pandas.
j = pd.concat([mine_h[name].rename('mine'), pub_h[short].rename('pub')], axis=1).dropna()Guard: the alignment is not accidental
Shifting our aggregation away from the end-labelled convention must make the agreement worse. If some other offset fitted better, the timestamp convention above would be wrong — and a reference that is silently offset against the tower would corrupt every comparison built on it, including the radiation-based timestamp-shift check.
_ref = pub_h['gre000h0']
_scores = {}
for _off in range(0, 4):
    _shifted = lae30['SW_IN_LAE_MS'].shift(_off)
    _h = _shifted.resample('h', label='right', closed='right').mean()
    _j = pd.concat([_h.rename('m'), _ref.rename('p')], axis=1).dropna()
    _scores[_off] = ((_j['m'] - _j['p']) ** 2).mean() ** 0.5
    print(f'  offset {_off} x 30min: rmse {_scores[_off]:8.4f}')

assert min(_scores, key=_scores.get) == 0, (
    f'a non-zero offset fits better ({_scores}) - the timestamp convention is wrong')
print('\nOK: offset 0 wins, and agreement degrades monotonically away from it.')
C:\Users\nopan\AppData\Local\Temp\ipykernel_6612\382275319.py:6: Pandas4Warning: Sorting by default when concatenating all DatetimeIndex is deprecated. In the future, pandas will respect the default of `sort=False`. Specify `sort=True` or `sort=False` to silence this message. If you see this warnings when not directly calling concat, report a bug to pandas.
_j = pd.concat([_h.rename('m'), _ref.rename('p')], axis=1).dropna()
C:\Users\nopan\AppData\Local\Temp\ipykernel_6612\382275319.py:6: Pandas4Warning: Sorting by default when concatenating all DatetimeIndex is deprecated. In the future, pandas will respect the default of `sort=False`. Specify `sort=True` or `sort=False` to silence this message. If you see this warnings when not directly calling concat, report a bug to pandas.
_j = pd.concat([_h.rename('m'), _ref.rename('p')], axis=1).dropna() offset 0 x 30min: rmse 48.6248
offset 1 x 30min: rmse 81.5346
offset 2 x 30min: rmse 111.9371
offset 3 x 30min: rmse 139.8651
OK: offset 0 wins, and agreement degrades monotonically away from it.C:\Users\nopan\AppData\Local\Temp\ipykernel_6612\382275319.py:6: Pandas4Warning: Sorting by default when concatenating all DatetimeIndex is deprecated. In the future, pandas will respect the default of `sort=False`. Specify `sort=True` or `sort=False` to silence this message. If you see this warnings when not directly calling concat, report a bug to pandas.
_j = pd.concat([_h.rename('m'), _ref.rename('p')], axis=1).dropna()
C:\Users\nopan\AppData\Local\Temp\ipykernel_6612\382275319.py:6: Pandas4Warning: Sorting by default when concatenating all DatetimeIndex is deprecated. In the future, pandas will respect the default of `sort=False`. Specify `sort=True` or `sort=False` to silence this message. If you see this warnings when not directly calling concat, report a bug to pandas.
_j = pd.concat([_h.rename('m'), _ref.rename('p')], axis=1).dropna()🌍 Shift to local time
The 10-min stamps are end-of-interval UTC, so the 30MIN product carries TIMESTAMP_END once shifted, matching our database.
# Label the file by the data it holds, not by where the labels land. Two separate
# off-by-one traps push the last stamp into the following year: end-labelling already
# puts the final bin of 31 Dec at 00:00 on 1 Jan, and the +1h local shift below pushes
# it again. Both are fixed by taking the year from the last bin's START.
_last_covered = lae30.index[-1] - pd.Timedelta(TARGET_FREQ)
YEARS = f'{lae30.index[0]:%Y}-{_last_covered:%Y}'
print(f'Last bin is labelled {lae30.index[-1]} but covers up to {_last_covered} -> years {YEARS}')

lae_out = lae30.copy()
lae_out.index = lae_out.index + pd.Timedelta(hours=TIMEZONE_OFFSET_TO_UTC_HOURS)
lae_out.index.name = 'TIMESTAMP_END'
lae_out['FLAG_INCOMPLETE'] = (lae_out['N_RECORDS'] < RECORDS_PER_BIN).astype(int)

print(f'Covered years (UTC): {YEARS}')
print(f'Now local (UTC+{TIMEZONE_OFFSET_TO_UTC_HOURS}): '
      f'{lae_out.index[0]} -> {lae_out.index[-1]}')
lae_out.head()
Last bin is labelled 2026-01-01 00:00:00 but covers up to 2025-12-31 23:30:00 -> years 2004-2025
Covered years (UTC): 2004-2025
Now local (UTC+1): 2004-02-01 01:00:00 -> 2026-01-01 01:00:00| TA_LAE_MS | RH_LAE_MS | TDEW_LAE_MS | VP_LAE_MS | PA_LAE_MS | SW_IN_LAE_MS | SW_IN_DIFF_LAE_MS | SUNDUR_LAE_MS | WS_LAE_MS | WS_GUST_LAE_MS | WD_LAE_MS | N_RECORDS | FLAG_INCOMPLETE | |
|---|---|---|---|---|---|---|---|---|---|---|---|---|---|
| TIMESTAMP_END | |||||||||||||
| 2004-02-01 01:00:00 | 4.400000 | 81.200000 | 1.500000 | 6.800000 | 921.100000 | 0.0 | NaN | 0.0 | 10.400000 | 21.0 | 219.000000 | 1 | 1 |
| 2004-02-01 01:30:00 | 4.466667 | 80.700000 | 1.433333 | 6.800000 | 921.166667 | 2.0 | NaN | 0.0 | 11.500000 | 25.0 | 216.999898 | 3 | 0 |
| 2004-02-01 02:00:00 | 4.533333 | 80.633333 | 1.466667 | 6.800000 | 921.066667 | 2.0 | NaN | 0.0 | 12.233333 | 26.5 | 216.333296 | 3 | 0 |
| 2004-02-01 02:30:00 | 4.700000 | 80.333333 | 1.600000 | 6.900000 | 921.500000 | 2.0 | NaN | 0.0 | 11.100000 | 23.1 | 217.000000 | 3 | 0 |
| 2004-02-01 03:00:00 | 4.600000 | 80.733333 | 1.566667 | 6.833333 | 921.633333 | 2.0 | NaN | 0.0 | 11.966667 | 24.8 | 217.000000 | 3 | 0 |
📊 Plots
fig, axes = plt.subplots(4, 1, figsize=(14, 11), sharex=True)
for ax, col, lab in [(axes[0], 'TA_LAE_MS', 'TA [°C]'),
                     (axes[1], 'RH_LAE_MS', 'RH [%]'),
                     (axes[2], 'SW_IN_LAE_MS', r'SW_IN [W m$^{-2}$]'),
                     (axes[3], 'PA_LAE_MS', 'PA [hPa]')]:
    _d = lae_out[col].resample('D').mean()
    ax.plot(_d.index, _d, lw=.5, color='tab:blue')
    ax.set_ylabel(lab)
    ax.grid(alpha=.3)
axes[0].set_title(f'MeteoSwiss LAE, daily means of the 30MIN product ({YEARS})')
axes[-1].set_xlabel('Year')
fig.tight_layout()
plt.show()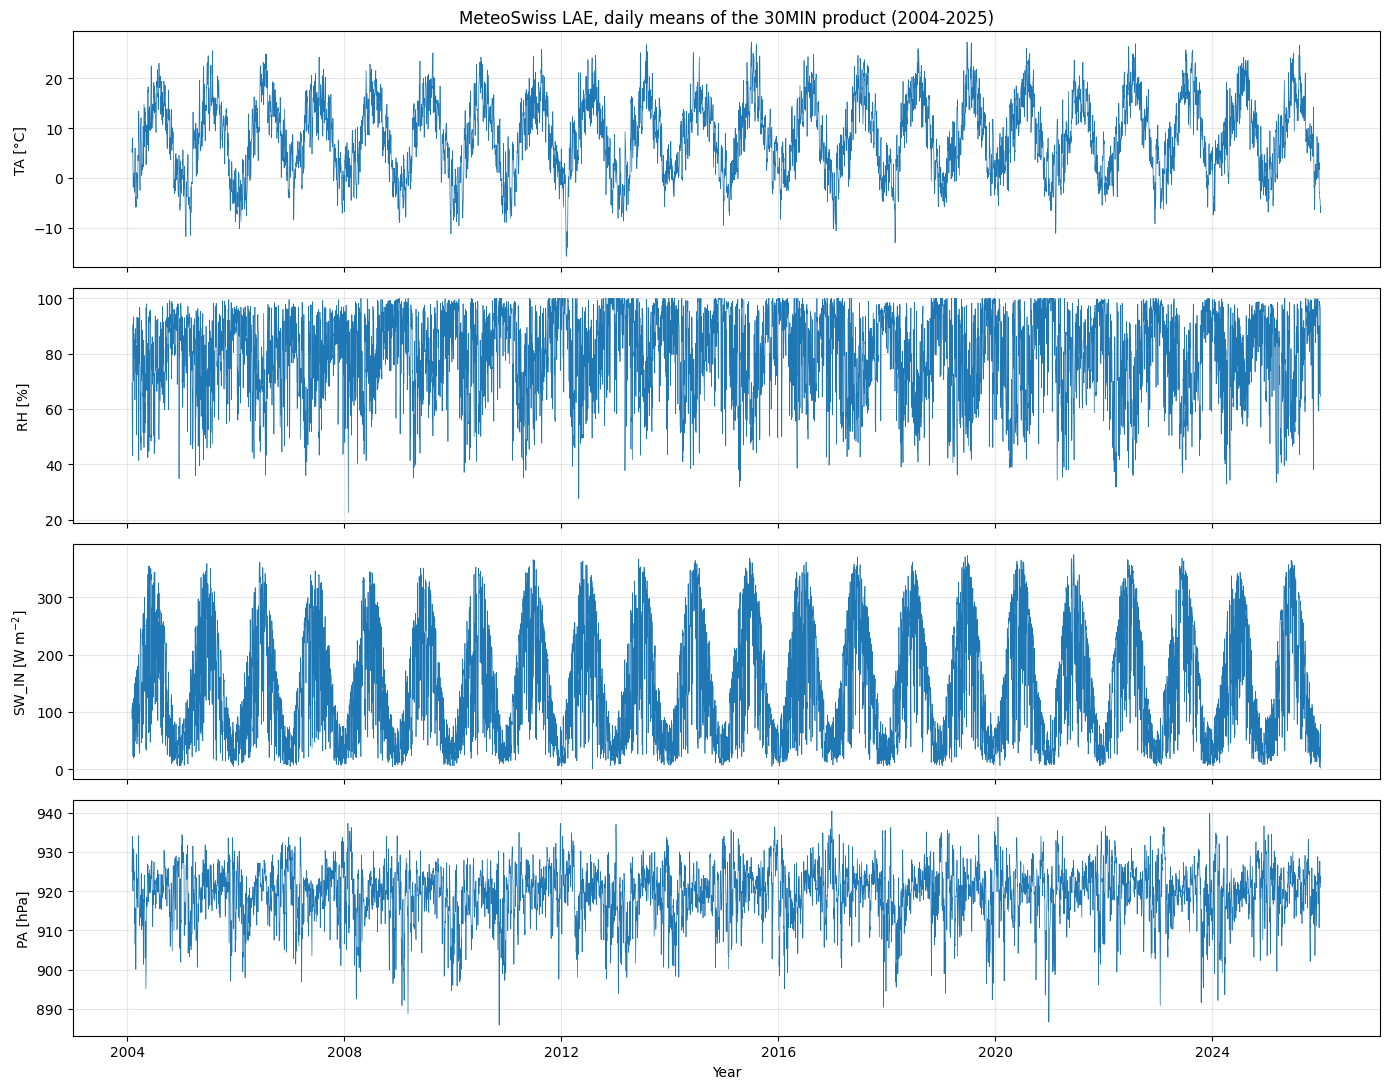
# Mean diel cycle per month: a shape check. A timestamp error would show as a
# radiation curve that is not centred on solar noon.
_sw = lae_out['SW_IN_LAE_MS']
_dc = _sw.groupby([_sw.index.month, _sw.index.hour + _sw.index.minute / 60]).mean().unstack(0)
fig, ax = plt.subplots(figsize=(11, 5))
for _m in _dc.columns:
    ax.plot(_dc.index, _dc[_m], label=f'{_m:02d}', lw=1.2)
ax.axvline(12 + TIMEZONE_OFFSET_TO_UTC_HOURS - 1, color='k', ls='--', lw=1,
           label='solar noon (approx)')
ax.set_xlabel('Hour of day (local)')
ax.set_ylabel(r'SW_IN [W m$^{-2}$]')
ax.set_title('Mean diel cycle of global radiation, by month')
ax.legend(ncol=7, fontsize=8, title='month')
ax.grid(alpha=.3)
fig.tight_layout()
plt.show()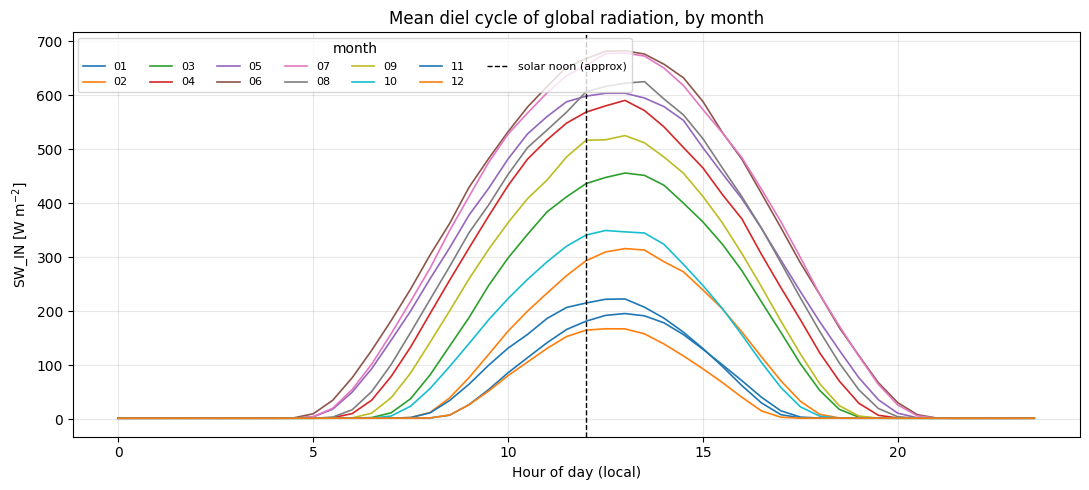
💾 Export
outdir = Path(OUTDIR)
outdir.mkdir(parents=True, exist_ok=True)

stem = f'{OUTNAME}_{YEARS}'
written = {}
for fmt in EXPORT_FORMATS:
    path = outdir / f'{stem}.{fmt}'
    if fmt == 'parquet':
        lae_out.to_parquet(path)
    elif fmt == 'csv':
        # index=True keeps the timestamp; NaN stays empty so a gap cannot be
        # mistaken for a real value when the csv is read back elsewhere.
        lae_out.to_csv(path, index=True, na_rep='')
    else:
        raise ValueError(f'unsupported export format: {fmt}')
    written[fmt] = path
    print(f'Wrote {path.name:<45s} ({path.stat().st_size / 1024:>8.0f} KB)')
print(f'\n  in {outdir}')
Wrote MeteoSwiss_LAE_30MIN_2004-2025.parquet ( 8707 KB)
Wrote MeteoSwiss_LAE_30MIN_2004-2025.csv ( 60775 KB)
in F:\Sync\luhk_work\dev-data\datasets-data\dataset_ch-lae_flux_product-data\workflow\10_METEO\10_REFERENCERead the written file back
Proves the file on disk is what we think it is, rather than trusting the in-memory frame.
back = pd.read_parquet(written['parquet'])
print(f'{len(back):,} records, {back.index[0]} -> {back.index[-1]}')
print(f'columns: {list(back.columns)}')
assert back.index.name == 'TIMESTAMP_END'
assert len(back) == len(lae_out)
assert back['TA_LAE_MS'].notna().sum() == lae_out['TA_LAE_MS'].notna().sum()
print('\nOK: file on disk matches the exported frame.')
back.describe().round(2)
384,241 records, 2004-02-01 01:00:00 -> 2026-01-01 01:00:00
columns: ['TA_LAE_MS', 'RH_LAE_MS', 'TDEW_LAE_MS', 'VP_LAE_MS', 'PA_LAE_MS', 'SW_IN_LAE_MS', 'SW_IN_DIFF_LAE_MS', 'SUNDUR_LAE_MS', 'WS_LAE_MS', 'WS_GUST_LAE_MS', 'WD_LAE_MS', 'N_RECORDS', 'FLAG_INCOMPLETE']
OK: file on disk matches the exported frame.| TA_LAE_MS | RH_LAE_MS | TDEW_LAE_MS | VP_LAE_MS | PA_LAE_MS | SW_IN_LAE_MS | SW_IN_DIFF_LAE_MS | SUNDUR_LAE_MS | WS_LAE_MS | WS_GUST_LAE_MS | WD_LAE_MS | N_RECORDS | FLAG_INCOMPLETE | |
|---|---|---|---|---|---|---|---|---|---|---|---|---|---|
| count | 383970.00 | 383934.00 | 383934.00 | 383934.00 | 383810.00 | 384128.00 | 266844.00 | 384096.00 | 381827.00 | 381827.00 | 383843.00 | 384241.00 | 384241.00 |
| mean | 8.33 | 79.29 | 4.40 | 9.11 | 919.50 | 141.51 | 59.41 | 6.22 | 4.44 | 7.39 | 173.37 | 3.00 | 0.00 |
| std | 7.88 | 18.69 | 6.44 | 3.90 | 7.34 | 231.39 | 92.23 | 11.36 | 2.37 | 3.93 | 100.18 | 0.08 | 0.03 |
| min | -17.70 | 3.67 | -27.03 | 0.67 | 881.70 | 0.00 | 0.00 | 0.00 | 0.00 | 0.00 | 0.00 | 0.00 | 0.00 |
| 25% | 2.27 | 65.70 | -0.50 | 5.90 | 915.63 | 2.00 | 0.67 | 0.00 | 2.67 | 4.50 | 55.67 | 3.00 | 0.00 |
| 50% | 8.33 | 83.27 | 4.57 | 8.47 | 920.43 | 5.33 | 4.33 | 0.00 | 4.20 | 6.70 | 203.33 | 3.00 | 0.00 |
| 75% | 14.23 | 96.77 | 9.63 | 11.97 | 924.27 | 189.33 | 86.67 | 4.00 | 5.90 | 9.40 | 236.36 | 3.00 | 0.00 |
| max | 32.90 | 100.00 | 21.43 | 25.57 | 942.53 | 1155.33 | 640.33 | 30.00 | 17.40 | 37.60 | 360.00 | 3.00 | 1.00 |
Note for downstream users
This product is a reference, not a screened series. It is exported exactly as MeteoSwiss published it, aggregated to 30MIN — no outlier removal, no gap-filling, no corrections. Gaps are real gaps. FLAG_INCOMPLETE marks bins built from fewer than three 10-min records.
Two things to remember when comparing against tower data:
PA_LAE_MSis measured at 845 m, the tower barometer at roughly 689 m. The two differ by the hydrostatic offset of ~156 m of air (order 15 hPa) and must not be compared without accounting for it.- January 2004 is absent, and diffuse radiation only begins in 2011.
print(f"Finished: {datetime.now().strftime('%Y-%m-%d %H:%M:%S')}")Finished: 2026-07-20 21:00:05